Pearson Edexcel · GCSE · Psychology
Course version: 1PS0 · Version from Sept 2017
Understand, and know the difference between: a. qualitative data b.…
Full specification wording
Data analysis: 11.2.5 Understand, and know the difference between: a. qualitative data b. quantitative data
Qualitative data is non-numerical, descriptive information that captures thoughts, feelings, and meanings.
Checked against the Pearson Edexcel 1PS0 specification (opens in a new tab) on .
- Point 5 of 5
- 2 key terms
Study notes
From the checked teaching notes for this specification point.
The idea
Qualitative data is non-numerical, descriptive information that captures thoughts, feelings, and meanings. For example, an interview transcript where a participant describes their experience of stress. Quantitative data is numerical information that can be counted, measured, and statistically analysed. For example, the number of words recalled in a memory test or a score on a rating scale from 1 to 10. The key difference lies in their form and analysis: qualitative data provides rich, detailed insights but is harder to analyse objectively, whereas quantitative data allows for easy comparison and statistical testing but may lack depth and context.
What earns the marks
- Identify qualitative data as descriptive, non-numerical information such as words or pictures.
- Identify quantitative data as numerical information that can be measured or counted.
- Distinguish between the two types of data based on their format and how they are analysed.
- Evaluate the strengths and weaknesses of each data type, such as the depth of qualitative data versus the statistical comparability of quantitative data.
Common mistakes and how to put them right
Mistaking a rating scale for qualitative data because it asks about feelings.
Put it right: Rating scales produce numerical scores, making them quantitative data.
Assuming qualitative data is always better because it is detailed.
Put it right: Both have strengths, but qualitative data is subjective and harder to analyse statistically.
Confusing the terms qualitative and quantitative.
Put it right: 'quant' relates to quantity (numbers) and 'qual' relates to quality (descriptions).
Exam tips
- When asked to identify the type of data in a scenario, look for whether the result is a number (quantitative) or a description in words (qualitative).
- Be prepared to explain one advantage of using quantitative data over qualitative data, such as ease of statistical analysis.
- If a question asks how to convert qualitative data to quantitative data, mention categorising responses and counting their frequencies.
Try the lesson
The start of the Data analysis: 11.2.5 Understand, and know the difference between: a. qualitative data b. quantitative data lesson, made from checked teaching notes for this specification point.
Have a go first
Which of the following is the best example of quantitative data being collected in a psychological study?
Listen
Qualitative data is non-numerical, descriptive information that captures thoughts, feelings, and meanings. For example, an interview transcript where a participant describes their experience of stress. Quantitative data is numerical information that can be counted, measured, and statistically analysed. For example, the number of words recalled in a memory test or a score on a rating scale from 1 to 10. The key difference lies in their form and analysis: qualitative data provides rich, detailed insights but is harder to analyse objectively, whereas quantitative data allows for easy comparison and statistical testing but may lack depth and context. A strong answer earns marks for these points. Identify qualitative data as descriptive, non-numerical information such as words or pictures. Identify quantitative data as numerical information that can be measured or counted. Distinguish between the two types of data based on their format and how they are analysed. Evaluate the strengths and weaknesses of each data type, such as the depth of qualitative data versus the statistical comparability of quantitative data. A common slip: Mistaking a rating scale for qualitative data because it asks about feelings. Instead, rating scales produce numerical scores, making them quantitative data. Exam tip: When asked to identify the type of data in a scenario, look for whether the result is a number (quantitative) or a description in words (qualitative).
See it

Key words
Say what each word means before you turn the card.
Qualitative data
Try answering aloud or in your head before turning the card.
Quantitative data
Try answering aloud or in your head before turning the card.
See every definition
- Qualitative data
- Descriptive, non-numerical information such as words or pictures that captures thoughts, feelings, and meanings.
- Quantitative data
- Numerical information that can be counted, measured, and statistically analysed.
Label the diagram
Some boxes have lost their names. Pick the right name for each number.
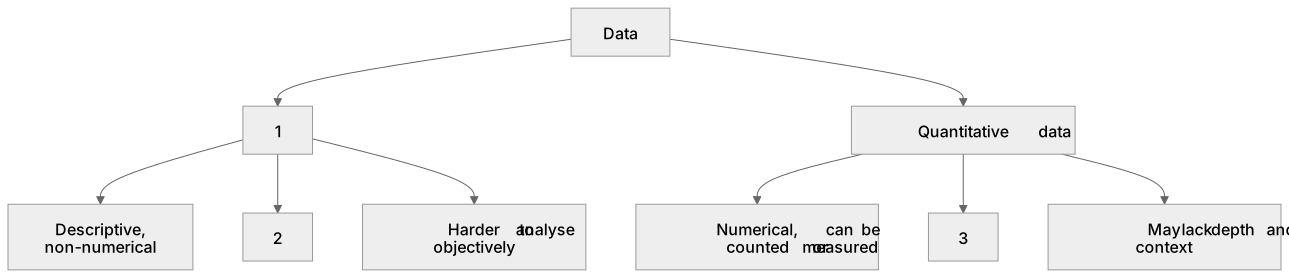
1Box 1
2Box 2
3Box 3
There is more to this lesson
The full lesson goes on to check your understanding and help you earn the marks. Create a free account to carry on, with your progress saved.
A week of Premium from your first lesson · Then the free plan continues · No card, no charge
Test your understanding of Data analysis: 11.2.5 Understand, and know the difference between: a. qualitative data b. quantitative data
Active recall beats re-reading. Take an instant quiz now to test what you’ve learned and lock it into long-term memory.
A week of Premium from your first lesson · Then the free plan continues · No card, no charge